The retrospective chart review: important methodological considerations
Article information

Abstract
In this paper, we review and discuss ten common methodological mistakes found in retrospective chart reviews. The retrospective chart review is a widely applicable research methodology that can be used by healthcare disciplines as a means to direct subsequent prospective investigations. In many cases in this review, we have also provided suggestions or accessible resources that researchers can apply as a “best practices” guide when planning, conducting, or reviewing this investigative method.
INTRODUCTION
The retrospective chart review (RCR), also known as a medical record review, is a type of research design in which pre-recorded, patient-centered data are used to answer one or more research questions [1]. The data used in such reviews exist in many forms: electronic databases, results from diagnostic tests, and notes from health service providers to mention a few. RCR is a popular methodology widely applied in many healthcare-based disciplines such as epidemiology, quality assessment, professional education and residency training, inpatient care, and clinical research (cf. Gearing et al. [2]), and valuable information may be gathered from study results to direct subsequent prospective studies.
Attesting to the popularity of this technique, a review of three emergency medicine journals revealed that nearly one-quarter of all research published within the study’s timeframe used RCR methodology [3]. Gilbert et al. [3] also examined methodological rigor in reporting practices from the RCRs in their sample. Predictably, they found that the majority of studies lacked sound methodological standards. Since poor methodology is a principal reason for peer-reviewed journal rejections, the aim of this article is to discuss common methodological mistakes and omissions made when conducting RCRs. The following methodological points stem from personal consultation experience as well as from the works of Gilbert et al. [3], Gearing et al. [2], Worster and Haines [1], and Findley and Daum [4]–all of which provide valuable information to consider when planning an RCR. When formulating the ideas presented herein, we used the standards provided by Gilbert et al. [3] to structure this paper while incorporating additional considerations which we deem to be important.
COMMON MISTAKES WHEN CONDUCTING A RETROSPECTIVE CHART REVIEW
1. Failure to create well-defined, clearly-articulated research questions
The first step when planning a RCR is to formulate a series of research questions that are to be answered based on results of the study. Research questions should be logical, flowing from that which is known or believed to be true to that which is unknown and requires validation [5]. Research questions form the initial structure of the RCR and guide the study design and data analysis. It is important to spend adequate time carefully scripting and revising the research questions for the study.
There is no shortage of published advice on developing and refining research questions . We have selected one framework for the design and articulation of research questions to present here which we have found to be particularly useful. Though not mentioned elsewhere in this manuscript, we recommend Morgan and Harmon [6] to the reader as an additional reference in properly framing research questions. The framework presented here is a typology of research questions. Such questions generally fall into one of three categories: questions of description, questions of relationship, or questions of comparison.
Questions of description are common to RCRs. These questions describe what is going on or what exists [7]. Incidence and prevalence research are descriptive. For example, we might formulate the research question, “What is the incidence rate for seasonal influenza among the elderly population in Belgium for the year 2009?” The answer to this question might be expressed in terms of a percentage. Other examples might include questions comparing characteristics and outcomes of patients with community-acquired pneumonia who were admitted to the Intensive Care Unit (ICU) with those patients managed on the ward [8] or characterizing hip joint pain referral patterns [9]. Results to descriptive questions are often reported as proportions, percentages, frequency counts, measures of central tendency (mean, median, mode), measures of variability (standard deviation, range), or various charts, graphs, and tables.
Questions of relationship ask how phenomena are related to one another [10]. As an example, we might pose the question, “What is the relationship between occupational burnout and suicide ideation among medical residents in the Northeast United States?” To answer this question, we would likely gather burnout and suicide ideation scores from the population of interest and then calculate a correlation coefficient to quantify this relationship. Other examples of this type might include examining the relationship between levels of community-reported infectious diseases and rate of neural tube defects [11] or assessing the relationship between the use of antipseudomonal drugs and the development of a resistance to Pseudomonas aeruginosa [12]. The answers to these types of questions are often provided in the form of a correlation coefficient. There are many such coefficients, and the proper choice of the coefficient is dictated by the nature of the data, including data level (nominal, ordinal, interval, or ratio) and the underlying distribution.
Questions of comparison ask about group or sub-group differences on a variable (or variables) of interest. The groups discussed in the above definition represent levels of the independent variable, whereas the variable examined across groups is known as the dependent variable. Questions of comparison are often used in randomized clinical trials. In a simple example, a group of patients with a particular disorder are randomly assigned to either a treatment or to a control group. The treatment group receives the intervention while the control group does not. At the end of the trial, the two groups are compared to assess the efficacy of the treatment. While questions of comparison may seek to establish cause-effect relationships, such is not always the case. We might pose the research question, “Are there differences between males and females on life satisfaction following a spinal cord injury?” In this example, the independent variable cannot be randomly assigned since gender is a pre-determined characteristic. This question still lends itself to comparison however. Other examples might include comparing the effect of fluid resuscitation with albumin or saline on mortality among ICU patients [13] or comparing four weight loss diets from low to high carbohydrate intake for effects on weight loss [14]. These types of questions are often answered by statistically comparing measures of central tendency across groups.
2. Failure to consider sampling issues a priori
There are two main issues that need to be addressed with respect to sampling considerations: the sample size and the sampling strategy. A mathematical process called power analysis can be used to help determine the number of charts needed for a particular study. Power refers to the probability that a statistical test will reject the null hypothesis when the alternative hypothesis is true. Let us consider an example to illustrate power more clearly. In a previously mentioned example, we posed a research question related to gender differences in life satisfaction following a spinal cord injury. The null hypothesis is always stated to reflect no difference. In this example, the null hypothesis would state that no difference would be found between males and females on a life satisfaction measure. Of course, researchers are often interested in rejecting the null hypothesis in favor of the alternative (there are statistically significant differences between males and females on life satisfaction). Having sufficient power is required to detect this statistically significant difference between genders.
Power is related to sample size. Studies with larger samples have greater power. For the researcher conducting an RCR, a sufficient number of patient records are needed to garner sufficient power. Various approaches to conducting a power analysis can be found in statistics textbooks and journal articles. A free, downloadable software program called G*Power 3.0 is a popular, user-friendly alternative to conducting power analysis. Faul et al. [15] discuss the utility of this program in greater detail.
The second sampling consideration is the strategy used to obtain the sample of patient records. While there are many sampling procedures available to the researcher, we will mention 3 methods here. Perhaps the most common strategy used in RCRs is the convenience sample. Using this method, researchers utilize medical information at their disposal. While this method presents limitations with respect to the generalizability of results, it is a practical method, particularly useful when dealing with rarer cases and smaller sample sizes. The second type of sampling method, random sampling, is the gold standard of these techniques. Elements from the population are selected at random, meaning that each medical record has an equal opportunity of being selected for coding. Random selection accounts for sampling bias and permits researchers to generalize their results to the population from which the sample was drawn. It should be noted that to effectively utilize random sampling, the researcher must have access to a substantial number of patient records. In cases where random sampling is feasible, we recommend its use. The third sampling technique is referred to as systematic sampling. Using this procedure, the researcher selects every k-th medical record for coding. While this method does take a systematic approach to sampling, it is not truly random. As before, this method requires access to large numbers of patient records. In sum, in instances where researchers have access to multiple sites or plan to study a common disorder or medical procedure, random sampling is the preferred method. In cases where information is limited, a convenience sample will be more practical.
3. Failure to adequately operationalize variables in the study
Operationalization refers to the act of “translating a construct into its manifestation” [16]. This term is widely used with social science research. Referring to our previous burnout example, we might adhere to a commonly applied construct definition of burnout as being multidimensional to include a sense of depersonalization, reduced personal accomplishment, and emotional exhaustion. To operationalize these aspects of burnout, Maslach et al. [17] created the Maslach Burnout Inventory which is the most widely used burnout assessment in the research literature. Turning our attention to RCRs, operationalization of variables occur through two steps. The first process that must occur a priori is identifying and defining the study variables. In some cases, this process may be straightforward. The categorization of a particular lab value, for example, will either fall within or outside of normal ranges, and these ranges are well-accepted and well-understood within a community of practice. In other instances, things are less clear. For example, consider the variable pain. Pain is a sensory experience that also has affective components. Katz and Melzack [18] and Melzack and Casey [19] discuss the sensory- discriminative, motivational-affective, and cognitiveevaluative psychological dimensions of pain. Furthermore, consider the quality of pain. In some cases, patients describe pain as throbbing, while others talk about a burning sensation. It is therefore important to think about how pain should be operationalized for a particular study. The second, and equally important, step in operationalization of a study’s variables requires a literature review to discover how other research studies have operationalized these same variables in similar or relevant works. Referring to the pain example, we might find that previous researchers studying pain used verbal or numeric rating scales, visual analogue scales, or the McGill Pain Questionnaire to operationalize this variable. By understanding how a variable has been operationalized in previous studies, researchers will likely be able to adopt an existing approach that is well-suited to address a particular research question. One useful tool that can be developed and included in the research manual is an appendix or glossary of definitions of the variables and relevant studies to support the use and definitions in the RCR [2]. By completing these steps, RCR investigators can significantly increase the reliability and validity of variables under investigation [20].
4. Failure to train and monitor data abstractors
The data abstractors who review and code each chart play an important role with respect to data quality. Coding must be performed accurately and consistently, or the validity of the data may be compromised. Prior to any data abstraction, coders must be carefully trained. Training should include a careful review of the variables, the procedural manual, and the data abstraction form. Following this review, data abstractors should code several patient records for practice. These coded elements should be carefully verified by the researcher to ensure accuracy. Any discrepancies in coding should be reviewed jointly and discussed to clarify any issues. After training, continual monitoring will be needed. This ensures that the abstractors are coding data accurately and in a timely manner. In the initial stages of abstraction, it might be advantageous to schedule a meeting with the data abstractors to discuss or clarify any issues that may have occurred during the coding process.
In addition to accuracy, consistency, and timeliness, the data abstractors must also remain objective. It is recommended that abstractors remain blind to the purpose of the study and the research questions that the RCR is attempting to address. As rightly noted by Gearing et al. [2], “Abstractors blind to the hypothesis decrease reviewer bias, specifically the possibility of their assessment being swayed by knowledge of others (e.g., investigators), concern over adversely effecting the study’s outcome, or interpreting their abstraction as too lenient or harsh.”
5. Failure to use standardized abstraction forms
When conducting an RCR, the abstraction form will help to ensure a measure of consistency among the abstractors while helping to reduce error in data collection. Abstraction forms can be either paper or electronic, both of which have unique advantages. The keys to either type of abstraction form are to have logical organization similar in flow to the format of the original charts and simplicity of question/response for the various operationalized variables involved in the study [2,20].
Paper forms can be cost effective and easier to use across multiple coding sites. If the researcher chooses to use a paper form, specific guidelines for the data recording and coding must be provided, or a structured and preprinted data form is given which allows no room for coder interpretation of the data collection. However, paper forms demonstrate a disadvantage for data collection when coder handwriting, response transcription, and form storage and maintenance are considered [1,2].
Electronic forms are advantageous when considering factors of large-scale RCR investigations, centralization of data storage, reduction of input and transcription error, and reduction in number of data evaluation and input steps [2]. Additionally, electronic forms, usually created out of a computer software package such as Microsoft Access, limit coder interpretation and may be designed to allow only specific code responses for the variable [1,2].
Regardless of the format chosen for the abstraction form, the coder(s) should be provided with training, explanations, and reviews of the expected code responses for each operationalized variable. Additional methods to reduce error in coding include providing exact numbers of character spaces for the coder to input the response. This removes an amount of error from variability in coder interpretation and response at each step of the coding process [1]. A small pilot test should be used to ensure that all coded elements of the abstraction form can be populated. In some cases, it might be noted that particular categories should be combined due to the infrequency of reporting. Errors or omissions may also be found based by employing an informal pilot test during this phase. (We discuss the need for a more substantial pilot study below).
6. Failure to create an adequate procedural manual for data abstraction
In addition to the abstraction form, an abstraction procedures manual should be created and compiled for the coders to further ensure accuracy, reliability, and consistency for all reviewers and coders. This manual should have a clear and detailed explanation of the protocols and steps for data extraction. When possible, illustrations or images of the form elements, the data or variable locations in the medical record, and acceptable response input into the abstraction form. Additional information such as data abbreviations, interpretations, synonyms, and shorthand symbols should be included within the text of the manual when discussing the variable analysis and form input or provided as a glossary for reference in the manual [20].
As often as possible, the investigator should detail decision tree/stem logic for as many potential coding situations as can be foreseen. If an unforeseen coding decision occurs, the investigator may choose to update the procedure manual to include the new coding decision stem so that all coders involved are able to follow the same logic decisions that may arise. This recommendation is particularly useful if there are multiple coders or multiple sites involved in the investigation. Standardization is key to ensuring that the study data is of sound quality.
7. Failure to explicitly develop inclusion and exclusion criteria
In addition to instructions for data abstraction, the procedures manual and research protocol should address chart inclusion and exclusion related to the study. Generally, once the research question has been developed and the protocols, including operationalization of study variables, have been established, the patient chart sample can be easily identified. However, close inspection and careful review of the literature and chart sample may allow for some exclusions to occur. Suggestions for exclusion criteria include sufficient lack of variables recorded in the chart, presence of excessive or confounding comorbidities, and/or the presence of confounding factors that would sufficiently degrade the validity of data from the chart. On the other hand, a more restrictive study methodology may call for specific criteria outlined in the protocols and abstraction manual to be met prior to inclusion in the RCR. In either methodology, the protocols must be clear, the abstractors must be trained in the inclusion and exclusion protocols, and a review of the excluded charts should occur among the abstractors and investigators to ensure that charts are not unnecessarily being included or excluded by one or several individuals.
8. Failure to address inter-rater or intra-rater reliability
Intra-rater and inter-rater reliabilities are a calculated statistical estimate that reports coding is consistent within or between raters. Intra-rater reliability evaluates the differences when the same abstractor recodes the same set of variables. Inter-rater reliability specifically measures the ability of two or more independent abstractors to reproduce identical coding. Inter-rater reliability may also be thought of as a measure of the amount of error among the coders of the data variable set [1].
Inter-rater reliability should be calculated and measured using Cohen’s kappa (κ), as opposed to a calculation of rate or percent agreement between/among the coders. Using a calculation of percent agreement will only indicate the agreement of coders within similar or identical abstractions, whereas κ will evaluate the extent of agreement between/among coders compared to the total agreement possible while restricting for the possibility of agreement by chance [1]. The easiest method for calculating κ is to utilize an internet site such as the Online Kappa Calculator which can be found at http://justus.randolph. name/kappa [21]. Cohen’s kappa will return a result within the range of -1 which demonstrates perfect disagreement to +1 which demonstrates perfect agreement. The minimum acceptable κ coefficient for RCR’s should be +0.6.
Intra-rater reliability measurements are compared using an intra-class correlation (ICC) calculation. To perform an ICC, a predetermined, randomized number of charts are selected and recoded by the abstractor for coding evaluation and calculation. Issues of error with intra-rater reliability arise because the coder’s subsequent evaluations have the possibility of contamination by knowledge of previous data coding [1]. ICC is computed using statistical software packages SPSS available from IBM at www.ibm.com/software/analytics/spss [22], the freeware R available from http://www.r-project.org [23], and Microsoft Excel, all of which have online tutorials such as those available at http://www.uvm.edu/~dhowell/StatPages/More_ Stuff/icc/icc.html [24], http://aliquote.org/memos/2011/04/ 29/computing-intraclass-correlation-with-r [25] and http:// www.real-statistics.com/reliability/intraclass-correlation/ [26], respectively.
9. Failure to perform a pilot test
Pilot tests, sometimes referred to as pilot studies, are smallscale versions of a research investigation which lack sample size to fully calculate statistics or answer the research question but are conducted to assess the study design, its feasibility, and evaluate the methodology and procedures of the investigation. Additionally, pilot tests will aid in determining the feasibility of data abstraction, highlighting the frequency that operationalized variable are missing from patient records, providing insight into an institution’s chart retrieval procedures and rates, testing inclusion and exclusion criteria, and evaluating potential data sampling and reliability concerns.
It is generally recommended that pilot tests should comprise approximately 10% of the targeted investigation sample and be selected through a randomized process. These recommendations help to ensure that abstractors have coded a sufficient number of medical records to feel comfortable with the process and evaluate the appropriateness of the variables and coding schemes. Randomization ensures that the charts coded are representative of the population of charts that the rater is likely to see during the coding phase.
10. Failure to address confidentiality and ethical considerations
Confidentiality and ethics in medical research is a very serious and highly regulated field, both institutionally and through the Federal government. The ethics and oversight of all human research has been codified in Title 45, Part 46 of the Code of Federal Regulations, specifically 45CFR46.101(2009). To aid with the oversight of research, 45CFR establishes and regulates the formation of Institutional Review Boards (IRBs), the scope of IRB research oversight, and under what circumstances research is exempt from IRB approval and oversight. According to 45CFR46.101(b)(4)(2009):
Research involving the collection or study of existing data, documents, records, pathological specimens, or diagnostic specimens, if these sources are publicly available or if the information is recorded by the investigator in such a manner that subjects cannot be identified, directly or through identifiers linked to the subjects [27].
This type of research described logically includes RCR studies, though it is our recommendation that IRB approval or validation of exclusion from oversight of the RCR and its protocols be obtained as each IRB may have unique insight and interpretation of its oversight scope.
The other consideration that must be accounted for in the RCR protocols is the legal and ethical responsibility to adhere to Federal law with respect to patient health information. The Health Insurance Portability and Accountability Act of 1996 (HIPAA) [28] among its many provisions is most widely recognized for establishing standards regarding the confidentiality of personal medical information (PMI) through the Privacy Rule. Under the HIPAA Privacy Rule, located within Title II, Administrative Simplification subtitle of the Act, all providers, plans, and clearinghouses are prohibited from using or disclosing protected health information except as authorized by a patient or when specifically permitted by regulation. The Rule also explicitly applies to all forms of communication of health information including oral, written, electronic, or any other means [29]. It cannot be overstated the importance of keeping these two ethical and legal codes in mind when developing and conducting an RCR.
CONCLUSION
In this paper, we have discussed ten common mistakes found in RCRs and have summarized the considerations in Table 1. In many cases, we have also provided suggestions or accessible resources that RCR researchers can put into practice. We appreciate the works of Worster and Haines [1], Gearing et al. [2], Gilbert et al. [3], and Findley and Daum [4] for providing their recommendations for chart review methodology, and in some cases, have used the recommended practices as a foundation for discussing these concepts in this paper. As RCRs continue to be a popular research methodology within the clinical sciences, researchers need to be aware of some common pitfalls that, if not handled, can affect the quality of their research as well as the validity and reliability of their data. Implementing a few common practices can greatly enhance the methodological rigor of an RCR and should be kept in mind when planning and conducting this type of study.
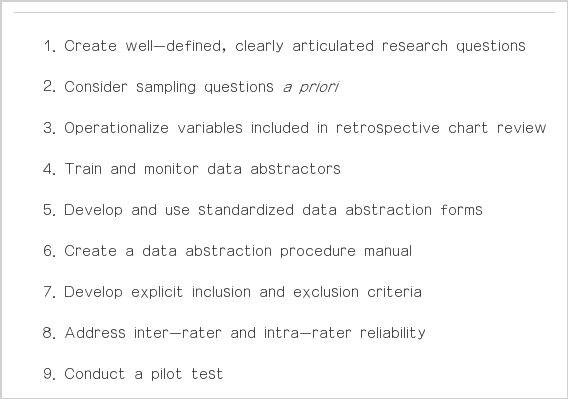
Summary of considerations for designing retrospective chart reviews studies
Notes
CONFLICT OF INTEREST
No potential conflict of interest relevant to this article was reported.
Supplementary material: Author’s audio recording of the abstract.