Modifiable variables in physical therapy education programs associated with first-time and three-year National Physical Therapy Examination pass rates in the United States
Article information

Abstract
Purpose:
This study aimed to examine the modifiable programmatic characteristics reflected in the Commission on Accreditation in Physical Therapy Education (CAPTE) Annual Accreditation Report for all accredited programs that reported pass rates on the National Physical Therapist Examination, and to build a predictive model for first-time and three-year ultimate pass rates.
Methods:
This observational study analyzed programmatic information from the 185 CAPTE-accredited physical therapy programs in the United States and Puerto Rico out of a total of 193 programs that provided the first-time and three-year ultimate pass rates in 2011. Fourteen predictive variables representing student selection and composition, clinical education length and design, and general program length and design were analyzed against first-time pass rates and ultimate pass rates on the NPTE. Univariate and multivariate multinomial regression analysis for first-time pass rates and logistic regression analysis for three-year ultimate pass rates were performed.
Results:
The variables associated with the first-time pass rate in the multivariate analysis were the mean undergraduate grade point average (GPA) and the average age of the cohort. Multivariate analysis showed that mean undergraduate GPA was associated with the three-year ultimate pass rate.
Conclusions:
Mean undergraduate GPA was found to be the only modifiable predictor for both first-time and three-year pass rates among CAPTE-accredited physical therapy programs.
INTRODUCTION
In the United States, formal educational training as a physical therapy professional requires clinical doctoral preparation that is sponsored by institutions of various types as reflected by its Carnegie classification, foci (e.g., research-intensive or liberal arts), sizes (e.g., small, medium, or large), and public or private status [1]. In the United States, the Commission on Accreditation in Physical Therapy Education (CAPTE) is responsible for formulating, revising, adopting, and implementing the evaluative criteria for the accreditation of physical therapist professional education programs [2]. Prior to becoming licensed to practice as a physical therapist in any of the 50 jurisdictions within the United States, one must graduate from a CAPTE-accredited physical therapy (PT) program [2] and obtain a passing score on the National Physical Therapist Examination (NPTE). For over 25 years, the NPTE has been administered by the Federation of State Boards of Physical Therapy (FSBPT), a member-driven organization that includes professionals, public members, and administrators [3]. The FSBPT collects data on first-time and three-year ultimate pass rates. Three-year ultimate pass rates reflect a three-year average of the students in a graduating class who completed the NPTE and passed, regardless of the number of attempts. The FSBPT advocates the use of a three-year ultimate pass rate because they argue that it is more indicative of a school’s overall performance [3]. Due to its importance to PT graduates and programs alike, many studies have examined predictors of passing the NPTE, including items that make up the educational culture of an institution that could markedly influence the educational experience of a learner [4-8]. Despite the recommendations of the FSBPT, in all studies that have examined predictive factors of NPTE performance, either the first-time pass rate or the one-year ultimate pass rate was the marker of success. No researchers have investigated the factors associated with three-year pass rates.
First-time and three-year ultimate pass rates for the NPTE are both measures that are known to influence the reputation of a program [5] and the qualitative assessment of a DPT program’s national ranking [8]. Consequently, the purpose of this study was to identify modifiable programmatic characteristics included in the CAPTE Annual Accreditation Report (AAR) for all accredited programs within the USA that were associated with first-time and three-year ultimate pass rates on the NPTE, and to build a predictive model reflecting those findings.
METHODS
Design and data source
This observational study included programmatic information from all CAPTE-accredited PT programs in the USA that graduated PT students in 2011. The data analyzed in this study were obtained in June 2014, and included the most recently tabulated results from the CAPTE AAR. The CAPTE AAR data provide institutional information about all accredited programs and contains general information, such as curriculum, program finance, format, admissions, and enrollment as well as graduation rates, outcome data, and faculty information. We requested data on variables reflective of general programmatic factors, clinical education experience, and summary information about student selection and composition.
Institutions
Summary institutional data were obtained from all 185 PT programs within the United States and the territory of Puerto Rico that provided pass rate data. A CAPTE representative masked the identifiers for each institution in the dataset, so that the investigators could not link specific data to a single institution. Selective descriptive characteristics about each institution were provided and included the Carnegie classification (divided into research intensive, doctorate/research, masters, and special focus), the institution type (e.g., liberal arts), public or private status, and geographic region based on CAPTE AAR categories. All data represented program-level information, since no individual student level data were available for this study.
Variables used in the modeling
Since the CAPTE AAR is very comprehensive, it contains several variables within the report that were potentially available for analysis in our study. We considered only those variables that were a) truly modifiable by a program, b) had limited missing values within the CAPTE AAR, c) were well represented in the previous literature, d) were reasonably extractable by the CAPTE representative who worked with our research team, and e) were consistently reported in the same fashion within the CAPTE AAR during the years of inquiry. Most importantly, we were interested in variables that represented unique aspects of the educational atmosphere or strategy of a single program. With this in mind, we targeted variables within three primary classifications: 1) student selection and composition, 2) clinical education experience length and design, and 3) general program length and design. Student selection and composition included three variables that have been previously explored as student-level characteristics: a) mean undergraduate grade point average (GPA) as a composite variable including the overall and prerequisite GPA, b) the racial and ethnic composition of a class (hereafter referred to as diversity), and c) age. Operationally, student-level factors are those that are associated with student characteristics or accomplishments. Clinical education experience length and design included five variables, none of which have been investigated previously, to the best of our knowledge: a) the percentage of American Physical Therapy Association (APTA)-credentialed clinical instructors, b) the total credit hours associated with clinical education experience, c) the quantity of contracted clinical education sites, d) the total weeks of clinical education experience, and e) the length (in weeks) of the terminal clinical education experience. General program length and design included the following six variables: a) class size, b) length of the program (in weeks), c) number of semesters, d) classroom and laboratory credits (didactic time), e) total programmatic credit hours (clinical education plus didactic time), and f) total semesters of undergraduate and graduate preparation. General program variables are purely associated with internal program characteristics and do not reflect student-level factors. A minority of these variables were also explored by Mohr and colleagues [8].
Descriptive institutional variables were collected in order to adequately describe the CAPTE sample. These variables included Carnegie classification, public or private institutional status, region, institution type, and institution size. The category of institution type was divided into allied health sciences centers, liberal arts, osteopathic, professional, or technical institutions. Size was divided into five categories based on the enrollment of students in the parent institution. The extra-large category included institutions with >20,001 students, large included institutions with 10,001-20,000 students, medium included institutions with 4,001-10,000 students, small included institutions with 1,001-4,000, and extra-small included institutions with ≤1,000 students.
Measurement of linearity of effect and multicollinearity
Linearity of effect and multicollinearity were evaluated for each the 14 independent variables. Linearity of effect was evaluated by identifying potential curvilinear relationships. If curvilinear relationships were found, we created categories and entered the variables as ordinal data with a set of indicators (dummies). We then plotted the individual estimates to visualize linearity and determined whether significant differences were present in the individual estimates. In order to assess multicollinearity in the modeling, correlation matrices were run for each independent variable. A correlational finding of r>0.7 between independent variables was used as a criterion for assessing potential multicollinearity [9].
Variable recoding
Categorical independent variables often lead to more meaningful and more easily understood findings when using modeling methods such as logistic regression. We categorized variables, as appropriate, either using logical and meaningful distributions or through receiver operating characteristic curves [10]. Using receiver operating characteristic curves, we determined the following cutoffs for the variables included in our study: a) GPA (≥3.52/4.00 and <3.52/4.00), b) diversity (≥15.62% and <15.62%), c) percentage of credentialed instructors (≥47.5% and <47.5%), d) total clinical education sites (>300 and ≤300), e) total weeks of clinical experience (>40 and ≤40 weeks), f) terminal clinical experience (>27.5 and ≤27.5 weeks), g) length of overall program (>122 and ≤122 weeks; range, 89-164 weeks), h) classroom and laboratory credits (>91 and ≤91 credits), and i) total programmatic hours (>122.25 and ≤122.25 credit hours). Average age, total clinical education credit hours, class size, and undergraduate and graduate semesters were analyzed as continuous variables.
Neither first-time pass rates nor three-year ultimate pass rates were derived from the CAPTE AAR data, but were provided to CAPTE by the FSBPT, masked by CAPTE, and then provided to our research team. The first-time pass rate was the percentage of individuals who passed on the first attempt from a single cohort of individuals within the targeted year of 2011. Three-year ultimate pass rates were also provided as percentage variables. Pass rates were heavily negatively skewed, to the point that all forms of appropriate logarithmic transformation still led to non-normally distributed findings. We elected to categorize pass rates using the median value, thus splitting pass rates into 1) 99% and above (a high pass rate) and 2) <99% (a low pass rates).
Determining the appropriate number of observations per variable
For simple univariate multinomial or logistic regression, Homer and Lemeshow [11] have recommended a minimum observation-to-variable ratio of 10:1, but cautioned that a number this low will likely overfit a model. We adopted their preferred observation-to-variable ratio of 20:1 for the multivariate modeling and limited our predictive variables to nine.
Data analysis
All analyses were performed using SPSS version 20.0 (IBM Corp. Armonk, NY, USA). Institutional characteristics, including means and standard deviations and frequencies with percentages, were reported for Carnegie classification, public or private status, region, institution type, and institution size for the 185 programs included within the CAPTE AAR. Comparative analyses among the 14 predictor variables were performed as well. We opted to present the results in terms of a dichotomy between high and low three-year pass rates, since the FSBPT argues that the three-year pass rate is a better predictor of the long-term success of a program.
Univariate logistic regression analyses were performed for each of the independent variables for both first-time and three-year ultimate pass rates. Logistic regression analysis was used because the pass rates were not normally distributed, could not be appropriately log-transformed, and failed to meet the assumptions of a linear regression analysis. For each univariate analysis, individual P-values, odds ratios (ORs), 95% confidence intervals (CIs), and Nagelkerke values were reported. The Nagelkerke value is a pseudo R-squared measure that investigates the usefulness of the model [12].
Associations in the univariate analyses with P-values ≤ 0.20 were considered in two distinct multivariate predictive models (one for the first-time pass rate and one for the three-year ultimate pass rate) [13]. Institutional characteristics (e.g., Carnegie classification, public or private status, etc.) that were found to be significantly different in the descriptive analysis were used as control variables. In both models, P-values <0.05 were considered to indicate significance.
Ethical approval
The study was approved by the Institutional Review Board of the Duke University Department of Orthopedics.
The study design was approved and expedited by the Institutional Ethics Review Board of Duke University, Durham, North Carolina, USA (protocol ID, Pro00056918).
RESULTS
The median overall pass rate was 99%. Dichotomizing pass rates into high and low resulted in 102 institutions with a high pass rate and 83 with a low pass rate. Table 1 presents significant differences among the pass rates of programs depending on Carnegie classification (P=0.02), public and private status (P<0.01), region (P<0.01), and institution type (P<0.01). Programs with high ultimate pass rates were more likely to be public institutions, in the south-Atlantic region, and part of an allied health science center.

Descriptive institutional characteristics categorized according to high or low three-year ultimate pass rates
Table 2 outlines the trends associated with the recoded 14 predictor variables. Several associations were found. A higher proportion of APTA-credentialed instructors (≥47.5%) were found in institutions with higher ultimate pass rates. Programs with higher pass rates seemed to have larger class sizes and offered more classroom and laboratory credits. However, despite these trends, only one variable (GPA) was different to a statistically significant extent (P<0.01) between the high and low pass rate groups.

Analyses of differences between programs according to modifiable programmatic variables
Univariate logistic regression analyses for first-time pass rates are presented in Table 3. Five statistically significant differences were found in the analyses. A higher mean GPA was associated with a higher pass rate (OR=3.68; 95% CI=1.99-6.81), lower programmatic racial diversity (a lower percentage of non-white students) was associated with higher pass rates (OR=0.34; 95% CI=0.18-0.64), younger age was associated with higher pass rates (OR=0.76; 95% CI=0.61-0.93), a higher percentage of APTA-credentialed clinical instructors was associated with a higher first-time pass rate (OR=1.87; 95% CI=1.04-3.38), and longer undergraduate and graduate preparation was associated a higher first-time pass rate (OR=2.41; 95% CI=1.09-5.30). The number of semesters and class size during the year of testing were found to have P-values <0.20 and were retained for the multivariate modeling.

Unadjusted univariate logistic regression analyses for first-time pass rates
The univariate logistic regression results for three-year ultimate pass rates are presented on in Table 4. Only one variable was significantly associated with three-year pass rates. Programs with a mean GPA ≥3.52 had 5.43 greater odds (95% CI=2.92-10.32) of being in the higher pass rate category than in the lower pass rate category. The percentage of APTA-credentialed clinical instructors, the total weeks of clinical experience, class size, and total undergraduate and graduate semesters demonstrated P-values <0.20 and were included in the multivariate modeling.
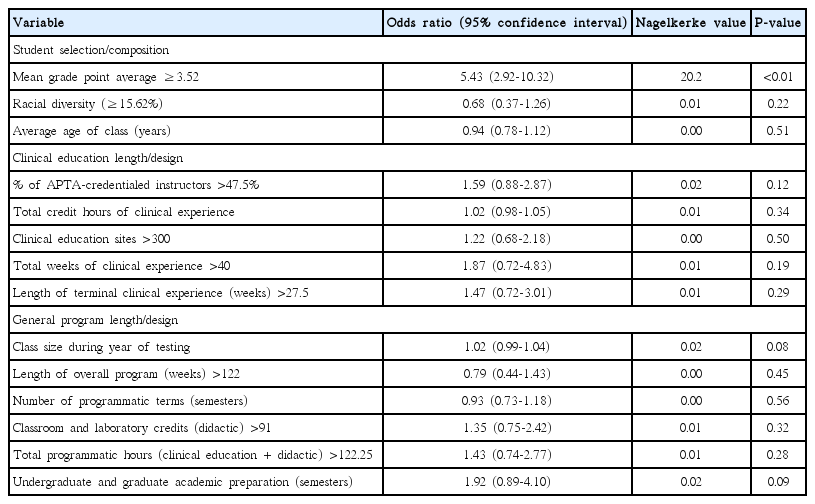
Unadjusted univariate logistic regression analyses for three-year ultimate pass rates
Multivariate logistic regression modeling with controls for Carnegie classification, region, institutional type, and public or private status are presented in Table 5. Multivariate modeling for first-time pass rates identified two statistically significant findings. A higher mean GPA was associated with a higher pass rate (OR=2.87; 95% CI=1.08-7.59), as was a younger age of the graduating cohort (OR=0.58; 95% CI=0.39-0.85). Only one variable was found to be associated with the three-year ultimate pass rate to a statistically significant extent; namely, a mean GPA ≥3.52 was significantly associated with a higher pass rate (OR=5.46; 95% CI=2.27-13.12).
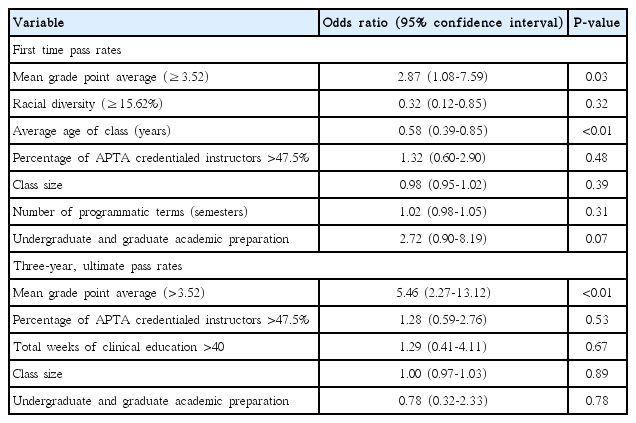
Multivariate logistic regression modeling including predictor
DISCUSSION
In the United States, PT educational programs often use pass rates as measures of programmatic reputation [5], and institutions with higher pass rates are frequently positioned higher in national reputation rankings [8]. Success on standardized tests such as the NPTE is hypothesized to be related to both individual student-level factors and programmatic factors. Our study analyzed modifiable programmatic factors and is unique because we included all CAPTE-accredited PT programs with graduating students for which data were available for first-time and three-year licensure pass rates.
Our findings demonstrate that of the predictive factors included in our categories of 1) student selection and composition, 2) clinical education experience length and design, and 3) general program length and design, only GPA showed a statistically significant association with the three-year pass rate, and only GPA and a younger cohort age showed a statistically significant association with first-time pass rates. Our findings, which emphasize the importance of GPA, are similar to those of other studies [5,6,14], which have evaluated the relationship of GPA with first-time or one-year licensure pass rates within the field of PT. Nearly all PT programs require a bachelor’s degree prior to entry into the professional phase of the program, or a mechanism to complete the bachelor’s degree by the time of graduation from the PT program [15]. However, the minimum GPA requirements likely vary considerably among all 185 programs, since the mean undergraduate GPA values ranged from 3.12 to 3.85.
What may be more surprising than the finding that mean undergraduate GPA influences three-year licensure pass rates is the fact that no other modifiable factors were found to be significantly associated with this outcome, regardless of adjustments made in the statistical models. While our assertion does not suggest that the educational experience received by the learner is not of value, it does suggest that the uniqueness of individual programs is either lost in the categorizations and analyses that we performed, or that such distinctiveness does not influence pass rates. If the findings from this study are taken on face value, and if three-year licensure pass rates were the only measure of program success, programs should focus exclusively on GPA during the admissions process. However, three-year licensure pass rates are certainly not the only measure of the success of an academic PT program [16]. Other measures of success may include clinical skills, professional service, leadership, and/or other qualitative elements that positively influence clinical care and professional growth.
The presence of a younger student cohort was associated with higher first-time pass rates but not three-year pass rates. Utzman et al. investigated the influence of age on academic performance problems and found that increasing age was a predictor of more academic problems [6]. Riddle et al. investigated student age as a predictor for licensure pass rate using data on 3,582 students from 20 programs [4]. The authors did not find age to be a significant predictor of first-time pass rates. Again, it may be worth noting is that our data from the CAPTE AAR do not represent student-level findings, but do represent the mean age of the cohort of each program.
To the best of our knowledge, this is the first study to report on associations between pass rate and institution type, and the first to identify differences in pass rates depending on public or private status and geographic region. Two studies exploring first-time pass rates and one-year pass rates did not find public or private status to be significantly associated with pass rates [5,8]. Furthermore, Utzman et al. found that geographic region was not related to pass rate [5]. We believe that these differences are likely reflective of our larger sample size, our improved representation of most programs in the United States, and the fact that we studied three-year pass rates.
This study is not without limitations. Categorizing continuous data always leads to losses in data sensitivity. In reality, other factors may contribute to first-time and three-year ultimate pass rates that were not included in our analyses, or the analyses of previous comparable studies.
In conclusion, this study found that of the modifiable programmatic factors investigated in this study, only mean undergraduate GPA influenced the three-year pass rate, while mean undergraduate GPA and a younger cohort were significantly associated with the first-time pass rate. This suggests that the design of the program (e.g., length of didactic training, clinical experience, etc.) influences licensure outcomes to a lesser extent than programmatic characteristics that consist of individual student factors. This also emphasizes the importance of selective admission policies if the only desired outcome is licensure pass rates.
Notes
No potential conflict of interest relevant to this article was reported.
SUPPLEMENTARY MATERIAL
Audio recording of the abstract.
Acknowledgements
The authors would like to thank Ellen Price PT, MEd, Lead Physical Therapy Programs Specialist from CAPTE who was instrumental in assisting with data preparation.