Health sciences students’ perception of the educational environment of KLE University, India as measured with the Dundee Ready Educational Environment Measure (DREEM)
Article information

Abstract
This study aimed to evaluate the educational environment of the health sciences programs of KLE University, Belgaum, Karnataka, India, to identify their strengths and weaknesses, and to suggest strategies to improve the educational environment to be on par with global standards. A cross-sectional study was conducted using the Dundee Ready Educational Environment Measure (DREEM) questionnaire, filled out by 914 of the 1,004 students (91.0%) who were majoring in medicine, dentistry, nursing, physiotherapy, and public health. The data were analysed according to the DREEM guidelines. Responses were received from 914 students, of whom 34.03% were men and 65.9% were women. The majority (67.1%) of students were 20-24 years of age. The mean overall DREEM score was 120.21±22.4 (maximum, 200) and approached the normal distribution (Lilliefors test, P<0.01). The DREEM scores of each group of students were as follows: dental, 125.0; medical, 122.4; public health, 121.0; physiotherapy, 117.0; and nursing, 116.3. Male students had more positive perceptions than female students (P<0.05), and postgraduate students had more positive perceptions than undergraduate students (P<0.05). The overall DREEM score (120.21) indicates that the educational environment was found to be more positive than negative.
This study aimed to characterize how students feel about their educational surroundings using the Dundee Ready Educational Environment Measure (DREEM) questionnaire, which can be used for obtaining a quantitative assessment of the educational environment, identifying strong and weak points, and suggesting areas for improvement. We administered the DREEM questionnaire to health sciences students in KLE University, India from April to November, 2013 [1]. The results of this cross-sectional study suggest ways to modernize and improve the learning environment of this institute.
Written approval was obtained from the Institutional Ethics Committee of KLE University. A total of 914 of the 1,004 students (91.0%) who were majoring in medicine, dentistry, nursing, physiotherapy, and public health responded to the questionnaire. We used the DREEM questionnaire along with a demographic component concerning age, gender, educational status, and area of study within the health sciences [2, 3]. The questionnaire was scored according to standard guidelines [4]. The DREEM questionnaire consists of five-point Likert-scale questions, scored as follows: strongly agree (4), agree (3), neutral (2), disagree (1), and strongly disagree (0). The score is reversed for negatively oriented questions. For the purpose of statistical analysis, the total score corresponding to which ranged from 0 to 200. The total DREEM score was then divided into four categories for interpretation, as follows: very poor (0-50), problematic (51-100), more positive than negative (101-150), and excellent (151-200). Furthermore, sub-scores were calculated for the following five domains of the educational environment: students’ perceptions of learning, students’ perceptions of course organizers, students’ academic self-perception, students’ perceptions of the institutional atmosphere, and students’ social self-perception. The students were formally briefed about the questionnaire in their classroom. If they consented to take part in the study, they were requested to provide their demographic details and mark their responses to each of the 50 statements. The mean, standard deviation, and frequency distribution were calculated, and the unpaired t-test, and one way analysis of variance were performed to assess whether responses showed significant variance according to sex, grade, and major. The Kolmogorov-Smirnov test and Lilliefors tests were applied to assess the normality of the distribution of the DREEM scores. SPSS version 21.0 (IBM Corp., Armonk, NY, USA) was used for statistical analysis. P-values <0.05 were considered to indicate statistical significance. The outcomes of the analysis were interpreted according to the guidelines accompanying DREEM.
Of the 914 students, 34.0% were male, 66.0% were female. The majority of students (67.1%) were 20-24 years of age, while 30.9% of students were 25-29 years of age. The mean age was 23.5±2.68 years. The surveyed students consisted of medical (40.6%), dental (28.7%), physiotherapy (13.5%), nursing (10.8%), and public health (6.5%) students. Furthermore, 48.4% were postgraduate students, 44.5% were undergraduate students, and 7.1% were interns. The overall DREEM Score was 120.2 (Table 1). The distribution of DREEM scores is presented in Fig. 1. When plotted graphically, the overall DREEM score showed an approximately normal distribution (Kolmogorov-Smirnov test, d=0.0783; P<0.01; Lilliefors, P<0.01). Medical students had more positive perceptions than public health students (P<0.05). Dental students reported more positive outcomes than nursing and physiotherapy students (P<0.05) (Tables 2, 3). Postgraduate students had more positive perceptions than undergraduate students (P<0.05) (Table 4). Male students responded more positively to statements assessing perceptions of learning, perceptions of the institutional atmosphere, and social self-perception (P<0.05) (Table 1). Tables 2 and 3 present survey responses according to the area of study of the respondents. Medical and dental students had more positive perceptions than nursing and physiotherapy students (P<0.05). Dental students had more positive academic self-perception than all other groups of students (P<0.05). A significant difference was found regarding perceptions of institutional atmosphere between medical and physiotherapy students (P<0.05). Postgraduate students showed more positive attitudes than undergraduate students in all five areas of study (P<0.01) (Tables 4, 5). The overall mean score for individual DREEM items was 2.8. Above-average scores were observed for items 2 (the teachers are knowledgeable), 10 (I am confident of passing this year), 15 (I have good friends in the school), and 19 (my social life is good). Scores below 2.8 were observed for items 3 (there is a good support system for students who get stressed), 8 (the teachers ridicule the students), 9 (the teachers are authoritarian), 17 (cheating is a problem in this school), 25 (the teaching over-emphasized factual learning), 39 (the teachers get angry in the class), and 48 (the teaching is too teacher-centred).

Comparison of the responses of male and female participants in KLE University health sciences programs to the entire DREEM questionnaire and to sub-domains
Graph showing the distribution of Dundee Ready Educational Environment Measure (DREEM) scores among the participants enrolled in health sciences programs at KLE University.

Comparison of the responses of participants in five health sciences programs of KLE University to the DREEM questionnaire, including both total DREEM scores and sub-domain scores, analysed by one-way analysis of variance

P-values after pairwise comparison using Tukey’s multiple posthoc procedure, reflecting the responses of participants enrolled in health sciences programs at KLE University. The total DREEM score and the five sub-domain scores were analysed according to the course of study, using one-way analysis of variance

Comparison of the responses of participants enrolled in health sciences programs at KLE University, assessing the relationship of their educational status with their total DREEM scores and sub-domain scores using one-way analysis of variance
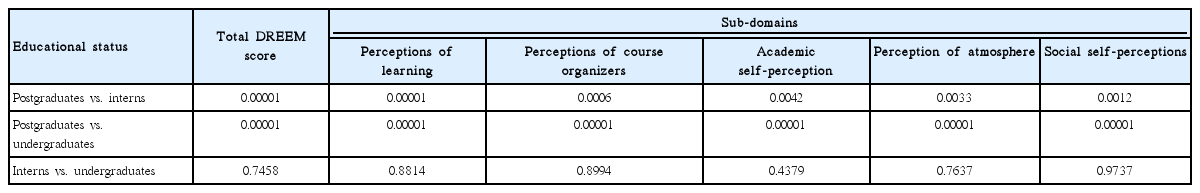
P-values after pairwise comparison using Tukey’s multiple posthoc procedure to assess the relationship of the educational status of the participants enrolled in health sciences programs at KLE University with their total DREEM score and sub-domain scores using one-way analysis of variance
The overall DREEM score was 120.2 (60.1% of the maximum possible score), indicating that students perceive their educational environment to be more positive than negative. Differences in the five sub-domains of scores depending on the course of study should be interpreted individually, since they did not always correspond to differences in the total DREEM scores. From the above results, it is possible to verify the weak points of the educational environment which should be reformed. Although the regimented structure and regulatory procedures of the institution are necessary, some scope for innovation may also be required [5]. In conclusion, it was possible to use the DREEM questionnaire to obtain a quantitative assessment of the educational environment and identify items for improvement in this institution.
Notes
No potential conflict of interest relevant to the study was reported.
SUPPLEMENTARY MATERIAL
Audio recording of the abstract.